
Strategy Dashboard
Rebalance Summary
Q4 2026
With the first half of 2026 fraught with headline risk, those hoping for a smoother ride in the third quarter were left disappointed. Renewed hostilities in the Middle East pushed energy costs higher, fanning inflationary pressure and complicating the task facing central bankers. The US Federal Reserve and European Central Bank raised interest rates, while longer-term bond yields have climbed to levels rarely seen over the past two decades. Viewed in isolation, this hardly sounds like a welcoming environment for risk assets. Yet corporate earnings have been doing considerably more than simply weathering the storm.
The apparent contradiction deserves scrutiny. Investors became accustomed to an economic regime in the post-global financial crisis era where subdued growth and inflation led to ultra-low interest rates and rising yields threatened to upset the arrangement. Monetary accommodation became central to the investment case for almost everything. But applying that framework today risks misreading a shifting economic environment supported by a very different set of growth drivers.
Corporate profits offer a useful starting point. Recent earnings seasons have delivered substantial growth across major markets, with companies repeatedly exceeding expectations. Technology remains a powerful contributor, but the strength has not been confined to a handful of American mega-caps. European companies and Asian exporters are also participating. Higher energy prices and some exceptional gains have flattered headline figures, but the underlying picture remains constructive. Rising revenues and healthy profit margins provide a firmer foundation for equities than a dependence on cheap financing.
Looking ahead, fiscal spending and corporate capital expenditures should continue to reinforce demand. Governments are investing in defence, infrastructure, energy security and domestic industrial capacity. These priorities are unlikely to disappear with the next central bank announcement. Meanwhile, the artificial intelligence buildout continues to generate enormous demand for computing capacity and the physical infrastructure required to support it.
Importantly, one company’s capital expenditure becomes another company’s revenue. Spending by technology platforms flows into semiconductor orders, electrical equipment, construction, cooling systems and power generation. Public infrastructure programmes create similar linkages across industries. The investment cycle’s economic reach thus extends well beyond the companies dominating AI headlines.
Where do higher bond yields fit into this picture? Relative to the past decade or two, current yields look elevated. But viewed over a longer history, they are considerably less unusual. An economy experiencing firm nominal growth, persistent inflation and strong demand for investment capital should not be expected to have the same borrowing costs as one characterized by subdued inflation and more modest investment spending.
That does not make higher yields painless. As financing costs rise, valuation multiples can come under pressure and heavily indebted businesses become more vulnerable. However, equities can accommodate higher yields when earnings are growing sufficiently to offset some of that pressure. The relationship depends on what is driving yields, not simply where they stand.
The important caveat is that an orderly adjustment can quickly become a disorderly one. A bond sell-off driven by deteriorating fiscal credibility or unanchored inflation expectations would offer little corresponding benefit to corporate earnings. An abrupt tightening in financial conditions could overwhelm otherwise healthy fundamentals. A prolonged energy shock would also erode purchasing power and squeeze margins, particularly in energy-importing economies. We continue to closely monitor these risks.
On balance, we remain relatively upbeat on global equities and pro-cyclical commodities. The earnings and investment cycles supporting this expansion have not run their course. But optimism should not be confused with complacency. Diversification and portfolio hedges remain essential as headline risk stays elevated and markets remain sensitive to sharp moves in bond yields and any signs of weakening corporate or government spending.
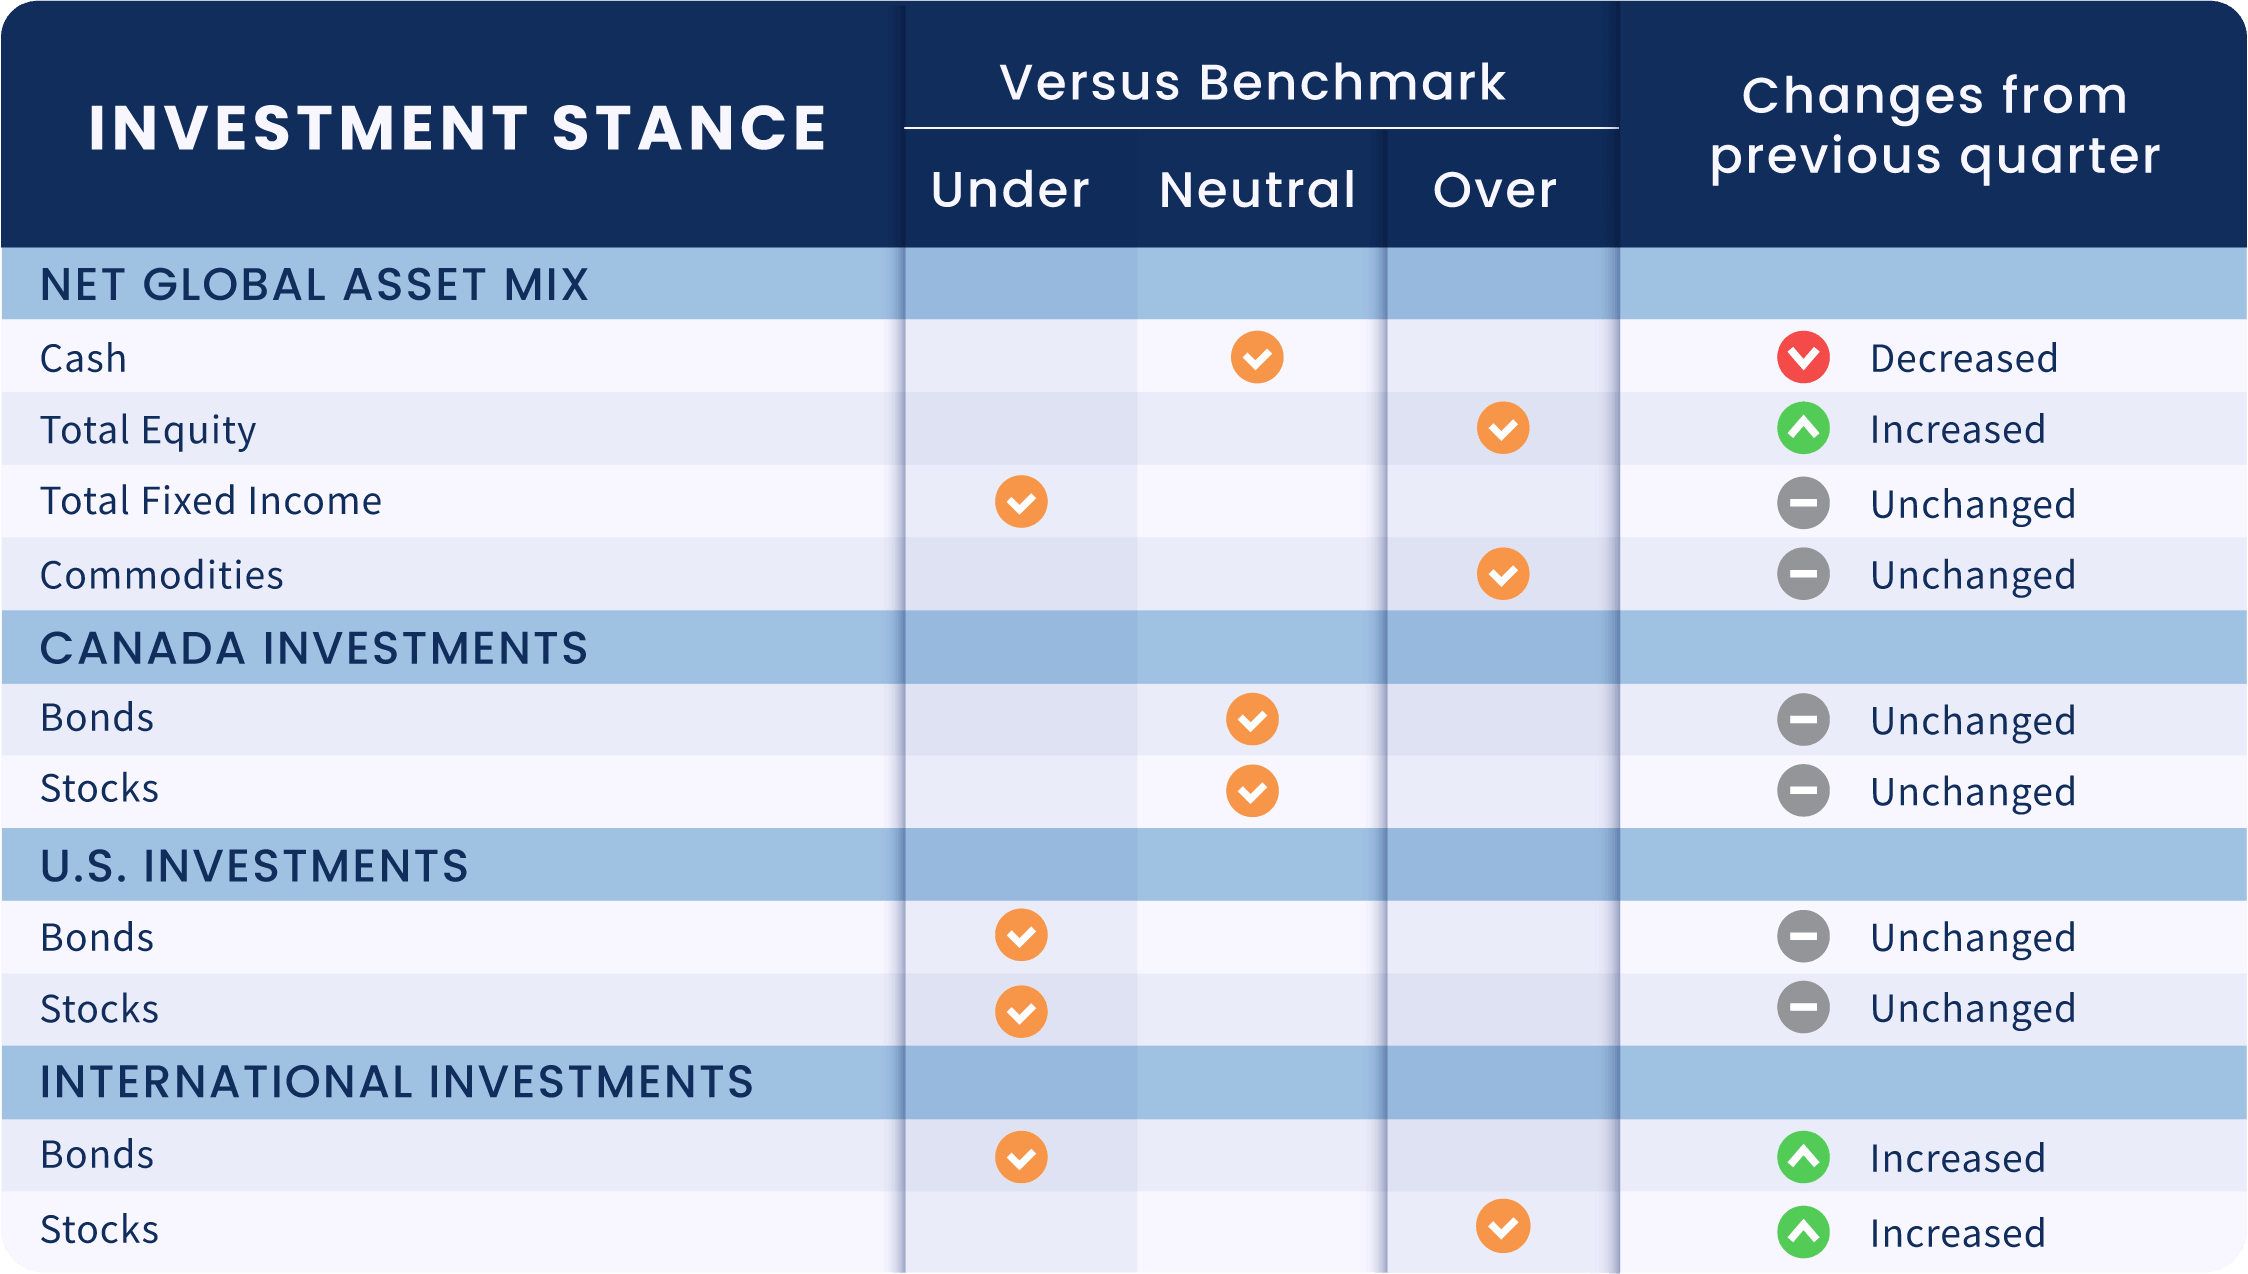
Cash & Currencies
Replacing HISA with money market exposure
- Numerous ETF options are available to boost strategy yield on cash and equivalent holdings.
- The yield on our current preferred exposure (a high interest savings account (HISA) ETF) has recently begun to trail behind money market ETF exposures, despite having a similar risk profile.
- We have modified our cash and equivalents composition this quarter; liquidating the HISA exposure and initiating a money market exposure.
Global Equities
Switching to high dividend EAFE equities
- Previously, the gap in dividend yields between market capitalization-weighted and high dividend developed market international equities was relatively small.
- With recent stellar performance, the dividend yield on market-capitalization weighted international equities has receded; necessitating a switch for income-oriented strategies.
- We have liquidated market-capitalization weighted international equities and initiated high dividend international equities in income-oriented strategies this quarter.
Liquidating Chinese onshore “A share” equities
- China’s economic picture remains uneven: domestic demand continues to lag, even as exports and manufacturing remain strong.
- Government priorities have become more skewed toward technological self-sufficiency rather than domestic demand reflation, raising the bar for the large, decisive stimulus that would typically help re-rate the onshore equity market.
- We have liquidated our exposure to onshore Chinese “A share” equities and invested the proceeds into a “core” broad emerging markets equity position in balanced and growth-oriented strategies this quarter.
Global Fixed Income
Maintaining underweight and short duration fixed income positioning
- In an environment of robust growth and sticky inflation, we expect the “path of least resistance” for long-term bond yields to be higher, even after a period of acute upwards pressure.
- While long-term bonds can enhance portfolio income generation, short-term bond yields are also grinding higher alongside central bank rate hikes, making the added interest rate risk at the long end of the curve even less attractive.
- We have maintained our underweight and short duration fixed income positioning this quarter.
Opportunity Investment Highlights
Initiating gold miner equities
- Elevated gold prices are translating into wider margins and stronger free cash flow for major gold mining companies, supporting dividends, buybacks and balance sheet improvement.
- Constrained mine supply and improved capital discipline also support the gold majors, which provide a higher beta exposure to our structural gold investment thesis.
- We have initiated a position in gold mining equities in growth-oriented strategies this quarter.

Looking for perspective beyond the headlines?
The information contained in these materials is for general informational purposes only and is intended to provide only brief comments on broad market, industry or sector trends, or other general economic or market conditions. It is not intended to provide an overview of the terms applicable to any products or funds managed or sponsored by Forstrong Global Asset Management Inc. (“Forstrong”). Views expressed regarding a particular company, security, industry, investment, or market sector are the views only of that individual as of the time expressed and do not necessarily represent the views of Forstrong or any other person in the Forstrong organization. These materials contain information and views as of the date indicated and such information and views are subject to change at any time without notice, based upon market and other conditions, and Forstrong disclaims any and all responsibility to update such information and views. These views are not and may not be relied upon as investment advice and, because investment decisions for a Forstrong fund or product are based on numerous factors, are not and should not be relied upon as an indication of trading intent on behalf of any Forstrong fund or product. Any opinion or assumption may contain elements of subjective judgment and are not intended to imply, nor should be interpreted as conveying, any form of guarantee or assurance by Forstrong of any future action or performance. Neither Forstrong nor any of its affiliates, businesses, or representatives make any representation or warranty, express or implied, as to the accuracy, reliability, completeness, appropriateness, or sufficiency for any purpose of any information contained herein. Forstrong and its affiliates and related entities disclaim any and all liability relating to the information herein, including, without limitation, any express or implied representations or warranties for, statements contained in, and omissions from, the information. Forstrong and its affiliates and related entities are not liable for any errors or omissions in any information herein or for any loss or damage suffered, whether direct or consequential, resulting from the use of these materials.
The information contained in these materials is strictly for general illustrative, educational, or informational purposes, and is not intended to provide legal, investment, accounting, or tax advice, and should not be relied upon in that regard. These materials contain information and views as of the date indicated and such information and views are subject to change at any time without notice, based upon market and other conditions, and Forstrong disclaims any and all responsibility to update such information and views. These views are not and may not be relied upon as investment advice. Any opinion or assumption may contain elements of subjective judgment and are not intended to imply, nor should be interpreted as conveying, any form of guarantee or assurance by Forstrong of any future action or performance. Neither Forstrong nor any of its affiliates, businesses, or representatives make any representation or warranty, express or implied, as to the accuracy, reliability, completeness, appropriateness, or sufficiency for any purpose of any information contained herein. Forstrong and its affiliates and related entities disclaim any and all liability relating to the information herein, including, without limitation, any express or implied representations or warranties for, statements contained in, and omissions from, the information. Forstrong and its affiliates and related entities are not liable for any errors or omissions in any information herein or for any loss or damage suffered, whether direct or consequential, resulting from the use of these materials.
Any specific companies, issuers, funds, ETFs, or indices mentioned are for illustrative or educational purposes only and are not and shall not be deemed to be a recommendation to buy or sell any securities. Any companies, issuers, funds, or ETFs mentioned do not necessarily represent current or future holdings of any Forstrong funds or products. Any strategies discussed are strictly for illustrative and educational purposes and are not a recommendation, offer, or solicitation to buy or sell any securities or to adopt any investment strategy. There is no guarantee that any strategies discussed will be effective.
Commissions, fees, and expenses all may be associated with investments in Forstrong funds, ETFs, and/or other investment products. Please read a fund’s offering memorandum or ETF’s prospectus, as applicable, which contains detailed information, and speak to an advisor before investing. Funds and ETFs are not guaranteed, their values change frequently, and investors may experience a gain or loss. Past performance may not be repeated.
Certain statements in these materials may contain forward-looking statements or forward-looking information that are predictive in nature and may include words such as “expects”, “anticipates”, “intends”, “plans”, believes”, “estimates”, and similar forward-looking expressions or negative versions thereof. Such forward-looking statements are based on current expectations and projections about future general economic, political, and other relevant market factors, such as interest, and assuming no changes to applicable tax or other laws or regulations. Expectations and projections about future events are inherently subject to, among other things, risks and uncertainties, some of which may be unforeseeable and, accordingly, may prove to be incorrect at a future date. Forward-looking statements are not guarantees of future performance, and actual events could differ materially from those expressed or implied in any forward-looking statements. A number of important factors can contribute to these differences, including, but not limited to, general economic, political, and market factors in Canada and internationally, interest and foreign exchange rates, global equity and capital markets, business competition, and catastrophic events. You should avoid placing any undue reliance on forward-looking statements. Past performance is no indicator of future performance and the materials are not intended to forecast or predict future events. Forstrong disclaims any and all responsibility to update any forward-looking statements, whether as a result of new information, future events, or otherwise, except as specifically required by law.
The index returns are shown for illustrative or informational purposes only. Indexes are unmanaged, and index performance does not include the impact of fees, commissions, and transaction costs and expenses that would be payable by investors in investment products that seek to track an index. Such costs would lower performance. It is not possible to invest directly in an index. Past performance does not guarantee future results. Index performance does not represent actual fund performance.
The allocation information shown above is for general informational purposes only and is intended to provide only a summary overview of Forstrong’s historical allocation methodologies over the indicated periods shown above. The above information is not meant to illustrate specific allocations or exposures within any particular Forstrong fund or product, including Forstrong exchange-traded funds (ETFs). The above information is historical in nature only and is not indicative of future results or actions. These materials contain information and views as of the date indicated and such information and views are subject to change at any time without notice, based upon market and other conditions, and Forstrong disclaims any and all responsibility to update such information and views. Graphs and charts are used for illustrative purposes only. The information, analysis, and opinions expressed herein are for general information only and are not intended to provide specific advice or recommendations for any individual or entity.
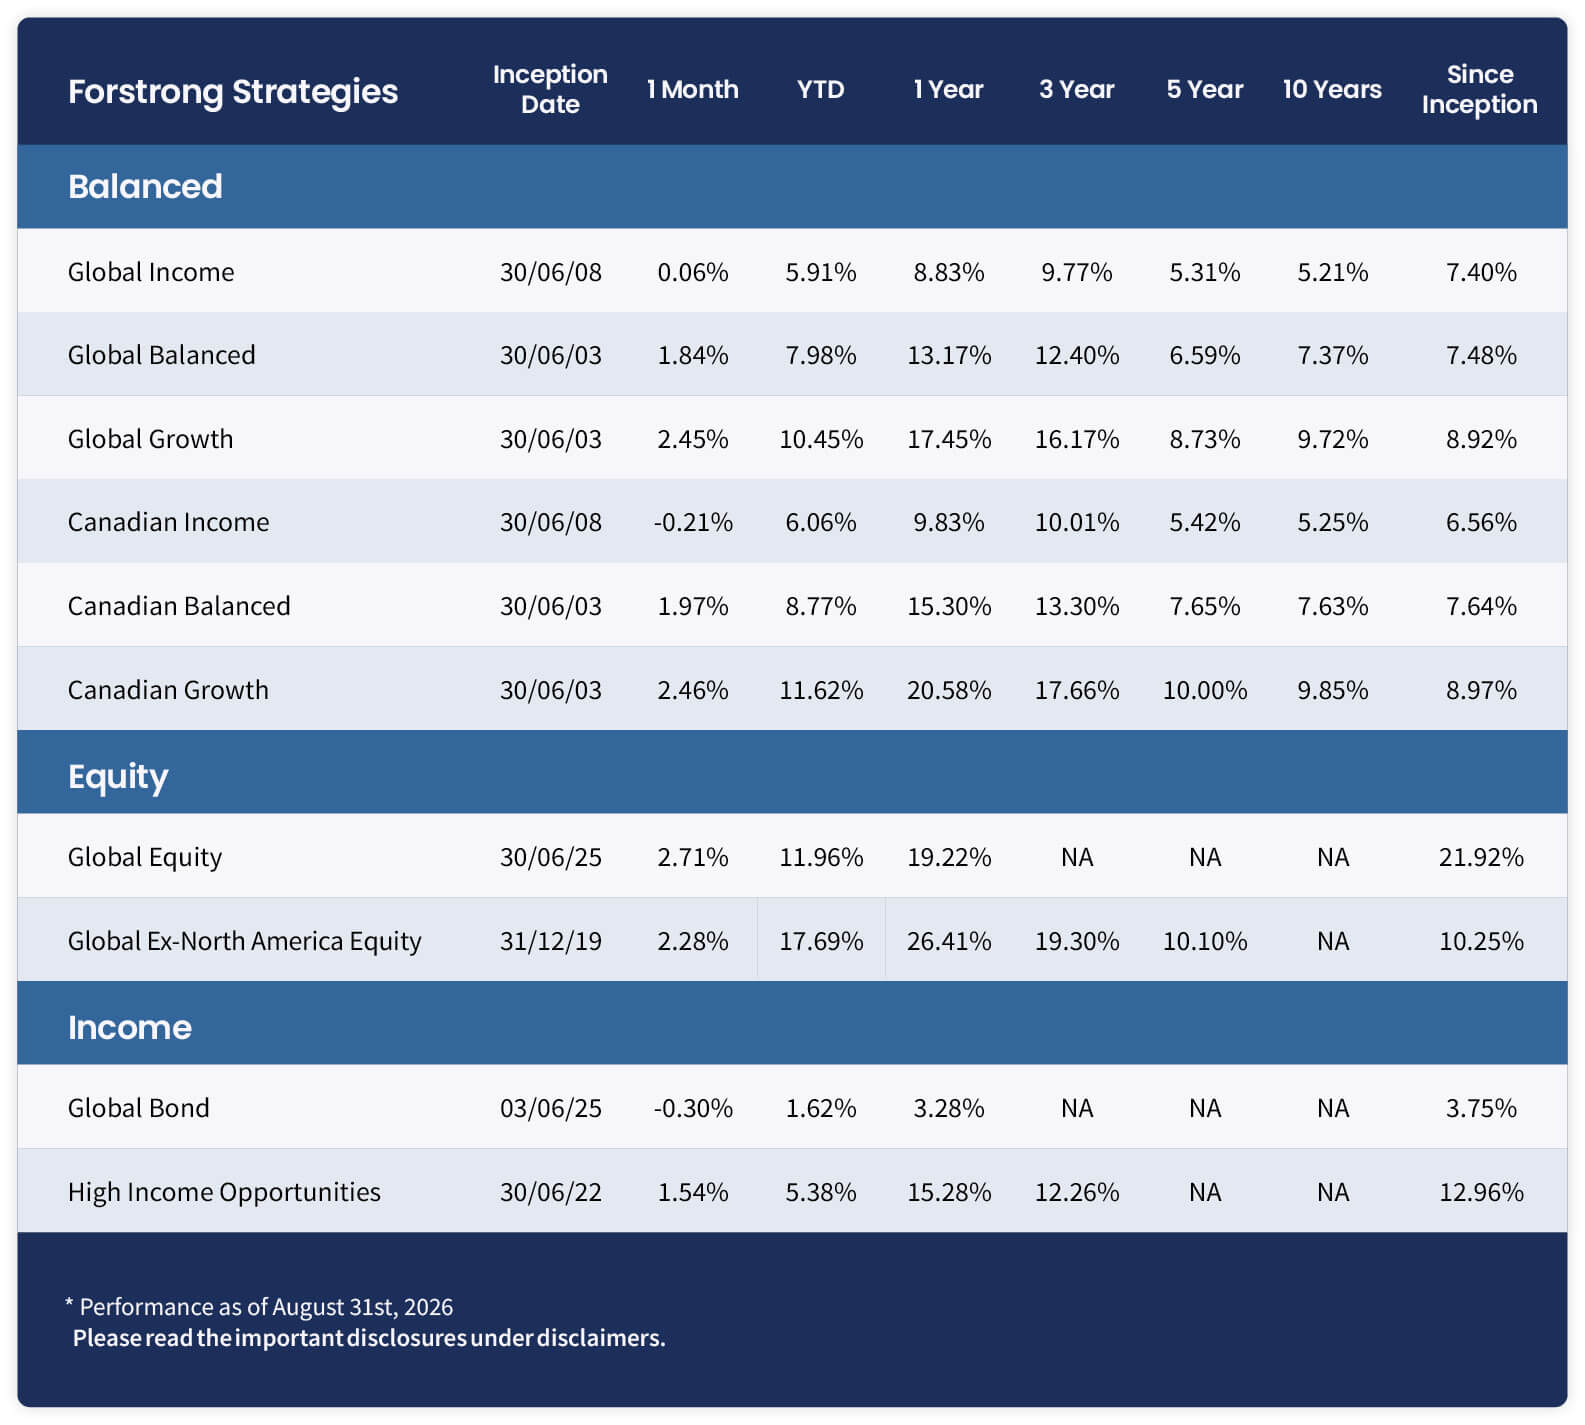
Commissions, fees, and expenses all may be associated with investments in Forstrong funds, ETFs, and/or other investment products. Please read a fund’s offering memorandum or ETF’s prospectus, as applicable, which contains detailed information, and speak to an advisor before investing. The indicated rates of return are the historical annual compounded total returns including changes in unit value and reinvestment of all distributions and do not take into account sales, redemption, distribution or optional charges or income taxes payable by any securityholder that would have reduced returns. Funds and ETFs are not guaranteed, their values change frequently, and investors may experience a gain or loss. Past performance may not be repeated.
The information contained herein is presented solely for illustrative purposes and should not be construed as a forecast or projection. While some information used herein has been obtained from various published and unpublished third-party sources considered to be reliable, such information has not been independently verified by Forstrong (and Forstrong disclaims any obligation to verify) and Forstrong does not guarantee its accuracy or completeness and accepts no liability for any loss or damage suffered, whether direct or consequential, resulting from its use. It should be noted that data provided may be approximate numbers.
©2026 Forstrong Global Asset Management Inc. All rights reserved.
Forstrong Global® and the Forstrong Global® logo are trademarks or registered trademarks of Forstrong Global Asset Management Inc. in Canada.